

CBOE Put/Call Ratio
What It Is & How to Read It Weekly

Following up on the big 8 indicators to follow weekly/monthly, and very limited demand on your time.
Let’s speak about Options. Rather, what investors and institutions are doing in this area.
Since options are inherently leveraged, there is a psychological element to this, as well as a hedging mentality, since institutions most assuredly aren’t betting on what Trump will do or say but are protecting their large stock market gains by buying puts.
What we are looking at is a ratio
The put/call ratio measures options volume: puts (bets on decline) divided by calls (bets on rise).
A reading above 1.0 means more puts than calls are being bought
fear, or less volatility in p/l dominates.
Below 1.0, calls dominate, and optimism/greed dominates.
The Two Versions to look for
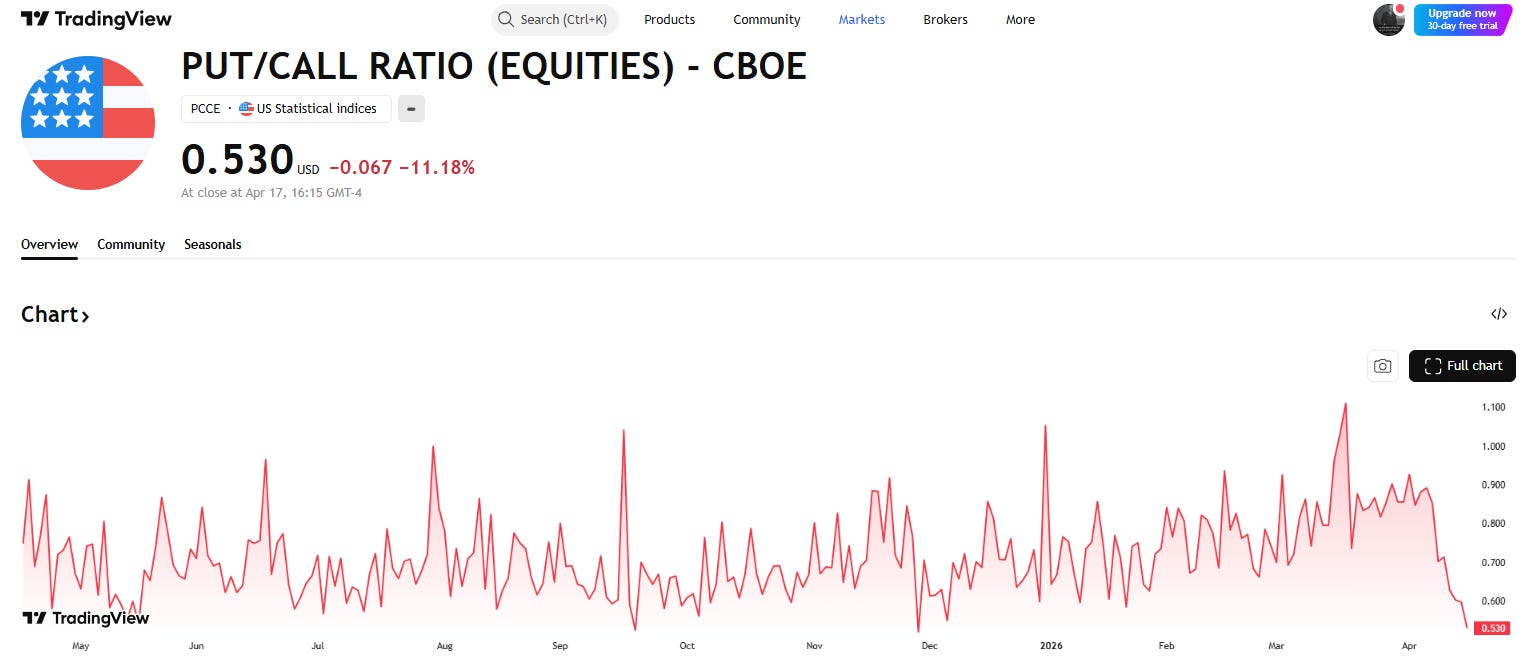
Equities Only (PCCE) — tracks single-stock options. Retail traders dominate this pool. More noise, but useful for gauging Main Street sentiment.
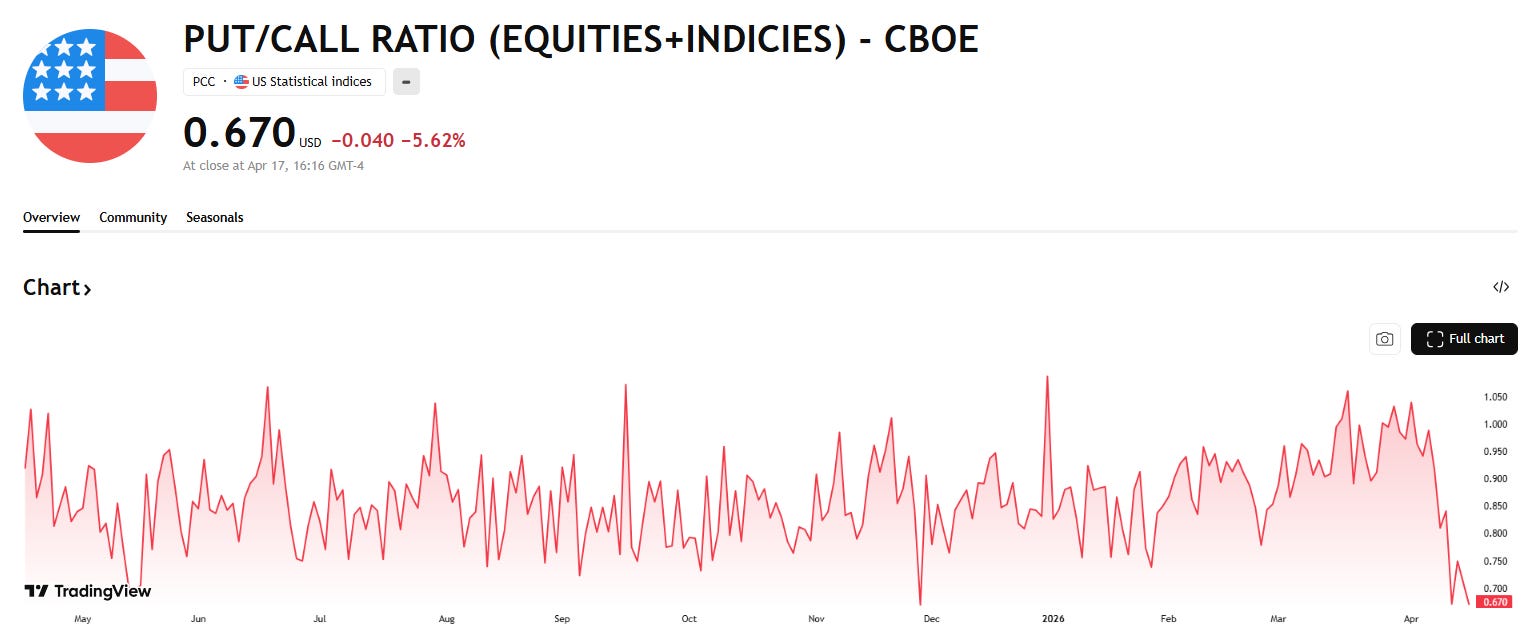
Equities + Indices (PCC) — adds index options (SPX, NDX, etc.), where institutions and hedgers operate. This is the more important signal because it captures big money protection-buying. When institutions are loading up on index puts, that’s a different conversation than retail panic.
So why not an indices-only CBOE? Because Claude didn’t tell me to do this.
(Rest assured will study this in a later missive)
The only free place I saw that has a chart with it is Trading View
https://www.tradingview.com/symbols/USI-PCCE/?timeframe=12M
https://www.tradingview.com/symbols/USI-PCC/
Regardless of the question I posed…you can see a subtle difference between the two
Index options (the difference between your two charts) are heavily used for hedging, not speculation.
So a spike in PCC during a rally can actually be bullish — institutions buying puts as portfolio insurance while staying long.
Context matters.
If the market is falling AND PCC is spiking, that’s genuine fear. If the market is flat or rising and PCC spikes, that’s professional hedging
a different read entirely.
Think of PCCE as the crowd’s mood and PCC as what the smart money is paying to protect itself.
What to look for
Is it above or below 0.8? Below = complacency territory, start paying attention to downside risk
Is it above 1.0? Fear is elevated — start watching for contrarian setups
Is it spiking vs. last week’s reading? A sudden jump of 0.2+ in a single week is more meaningful than a gradual drift
LETS APPLY THIS NOW
From the chart above I saw four extremes
NOW - So what will happen?
March 17, 2026 - The put/call diverged one hit a high and the other did not. hmmm
Dec 27, 2025 - right before holiday, no activity
May 14, 2025 - until today, this was the low (or extreme optimism) lets see what happened
From the chart of the SP500, the market had quick and stiff sell-off
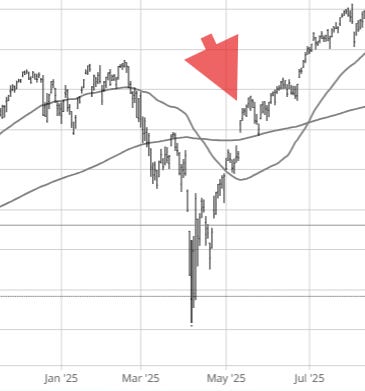
So the data is saying that as of today, we should be a little bit cautious
Now let’s add
1+1=2
Combine both CBOE and accumulation/distribution from our previous email
If breadth is deteriorating AND put/call is still low (complacency), that’s a dangerous combination.
Have a look and share what you observed in chat
COMPUTER GENERATED TRADE
Not bad! Calling a top and bottom in crude will this week work as well?
COCOA hit support and must rally monday/tuesday - As of this writing it has, very big pivot level
I saw an article on Water and pulled up AWK, a water utility
The stock spiked and is positive now as long as $130 holds
Happy Monday
Be on the lookout for some podcast I’ll be putting out
Eric