

Hidden in Plain Sight
But you need to be looking at the right angle

Have you ever been to a carnival of mirrors and you are looking something but it’s actually an optical illusion?
This is what we are experiencing in the financial markets now.
No one is there really to help because no one is really looking at the right angle.
My objective is to act BEFORE the crowd.
You don’t want to be Khalid who sings…after the fact:
Should've saw it comin'
(Hidden in front of me)
In plain sight
The headlines are blaring triumph. Record highs in the stock market. Trump celebrating but with a Freudian slip.
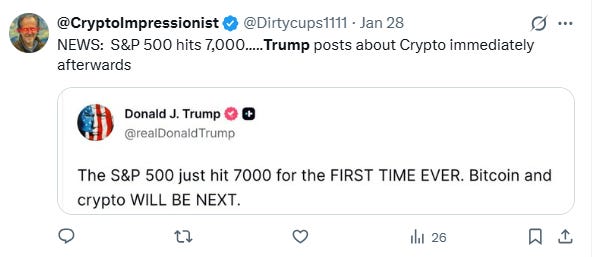
The implication is that Bitcoin will crash to $7000 but obviously he doesn’t mean that. And Gold blasting away to $5500.
This is how it works. Everyone thinks they’ve seen this show before. They watched Bitcoin run to $126,000 in October. They saw gold break $4,000, then $5,000. And depending on the perspective, they are positioning accordingly.
But they’re looking at the wrong chart.
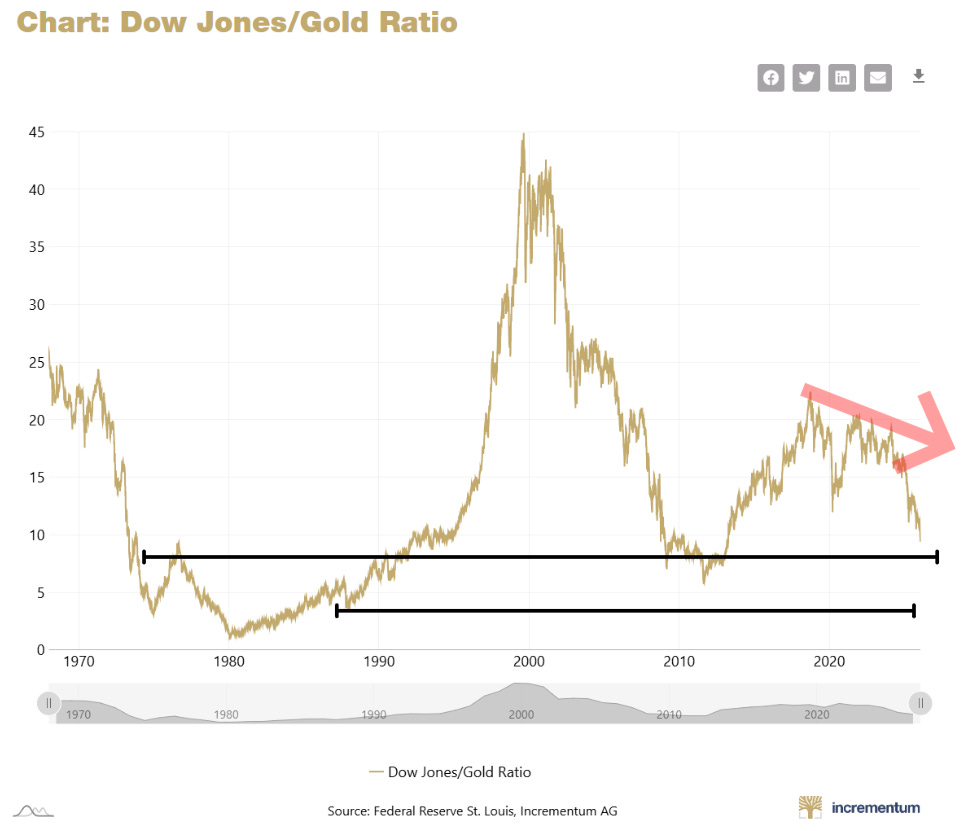
The Chart That Matters
The Dow-to-Gold ratio currently sits around 11:1. To buy the Dow, you need roughly eleven ounces of gold.
For context: In 1999, at the peak of the dot-com bubble, that ratio touched 43:1. Then it collapsed to 6:1 by 2011. In 1980, during the last great gold bull market, it briefly touched 1:1.
We have been in a bear market since 2000!
Way before Bitcoin.
Right now, the ratio is in confirmed decline. The structure is unmistakable to anyone who bothers to look.
DON’T THINK, LOOK
The market is crashing. You just don’t know it yet.
The Mechanics of Invisible Decline
This is how governments and markets have learned to manage catastrophe. You don’t let the nominal numbers go red — that causes panic, bank runs, regime change. Instead, you let the denominator do the work.
Stock market up 10%? Celebration. Charge client crazy fees.
Gold up 60%? Barely mentioned. Client hangs phone up on you.
The average retail investor sees green on their screen and feels wealthy. They don’t calculate their portfolio in ounces of gold, barrels of oil, or hours of labor. They calculate in dollars — a unit that’s depreciating against hard assets faster than at any point since the 1970s.
This is the 2000 crash running in slow motion, denominated in something other than dollars. The market hasn’t found a bottom yet. Gold hasn’t found a top.
What the Crowd Misses
What the crowd has actually seen is the beginning of a monetary regime shift. Or a realignment.
When the President of the United States shrugs off a multi-year low in the dollar, the market hears “sell the dollar.” That’s not a fleeting headline. That’s policy (at least for a day).
The Miners
Here’s where it gets interesting for those paying attention.
Gold mining companies are operationally leveraged to a metal making new highs daily. Yet many trade at valuations suggesting gold is still at $2,000. The sector remains the orphaned stepchild of the investment world — too boring for the crypto crowd, too volatile for the institutions, too unfamiliar for the indexers.
Juniors can become majors in this environment. The math is simple: a mine that was marginal at $2,500 gold becomes a cash machine at $5,500. Reserves get revalued. Projects that were shelved become viable. The entire capital structure of the sector reprices.
As I have for awhile, along with other nuggets, I share some ideas below, or come on chat and maybe have a pleasant discussion.
