

The Krogers Indicator
Breadbasket of the USA?

I discovered this indicator by trial and error. I’ve been watching this stock since I first subscribed to Value Line a long time ago, while also reading about the founder of Armco (JD Vance’s hometown steel mill), who got his start working at Krogers. Didn’t buy or consider it until the market crashed in 2008. My thinking was that people would buy and eat more from grocery stores and less at expensive and not-so-tasty restaurants, and overpriced coffee shops wouldn’t get any traffic, like Starbucks. Heck, even Krogers thought that through by having Starbucks in its stores. Recently, I see a trend of some of my staff enjoying a nice chicken lunch from the local grocery chain but its 2025 now. Has anything changed?
The reason I looked at Krogers is that for longer-term investments, I tend to favor stocks that trade around, and hopefully below, book value. So I bought the shares but got bored of it and sold (something of which I learned to overcome). As soon as a I sold it became for a brief period a popular momentum stock (see how this always happens) and came to learn that Berkshire Hathaway has consistently been buying Krogers and it has done very well for the company. But once Berkshire buys something I tend not to look at it. They take such a huge stake in something and I don’t feel the investment trades like a truly free stock.
Someone asked me awhile back about the state of the economy, so had a look at grocery companies, even Walmart, and assumed groceries do well in a recession or in a sell off it’s a safe haven as people need to eat. What I saw instead was a solid dependable growth company where you can park your money with a lot more confidence and a lot less Tums than an AI company with satisfactory returns - during bull markets. As an aside, Krogers helps in the argument that buying what you know and observe than what you hear and are promised on CNBC (goes with Bitcoin also).
By looking at a 30 year chart, you can see clearly that every high point in Krogers was the same period of a big market correction and volatility. This is important as my brother thought the dates labels showed bottoms? Do you see what I see?
When you look at a chart you better have pre-defined rules…and if someone sees something completely opposite and you cant convince him otherwise maybe your imagining aliens and not reality (I don’t believe in aliens so why should I believe in squiggly lines).
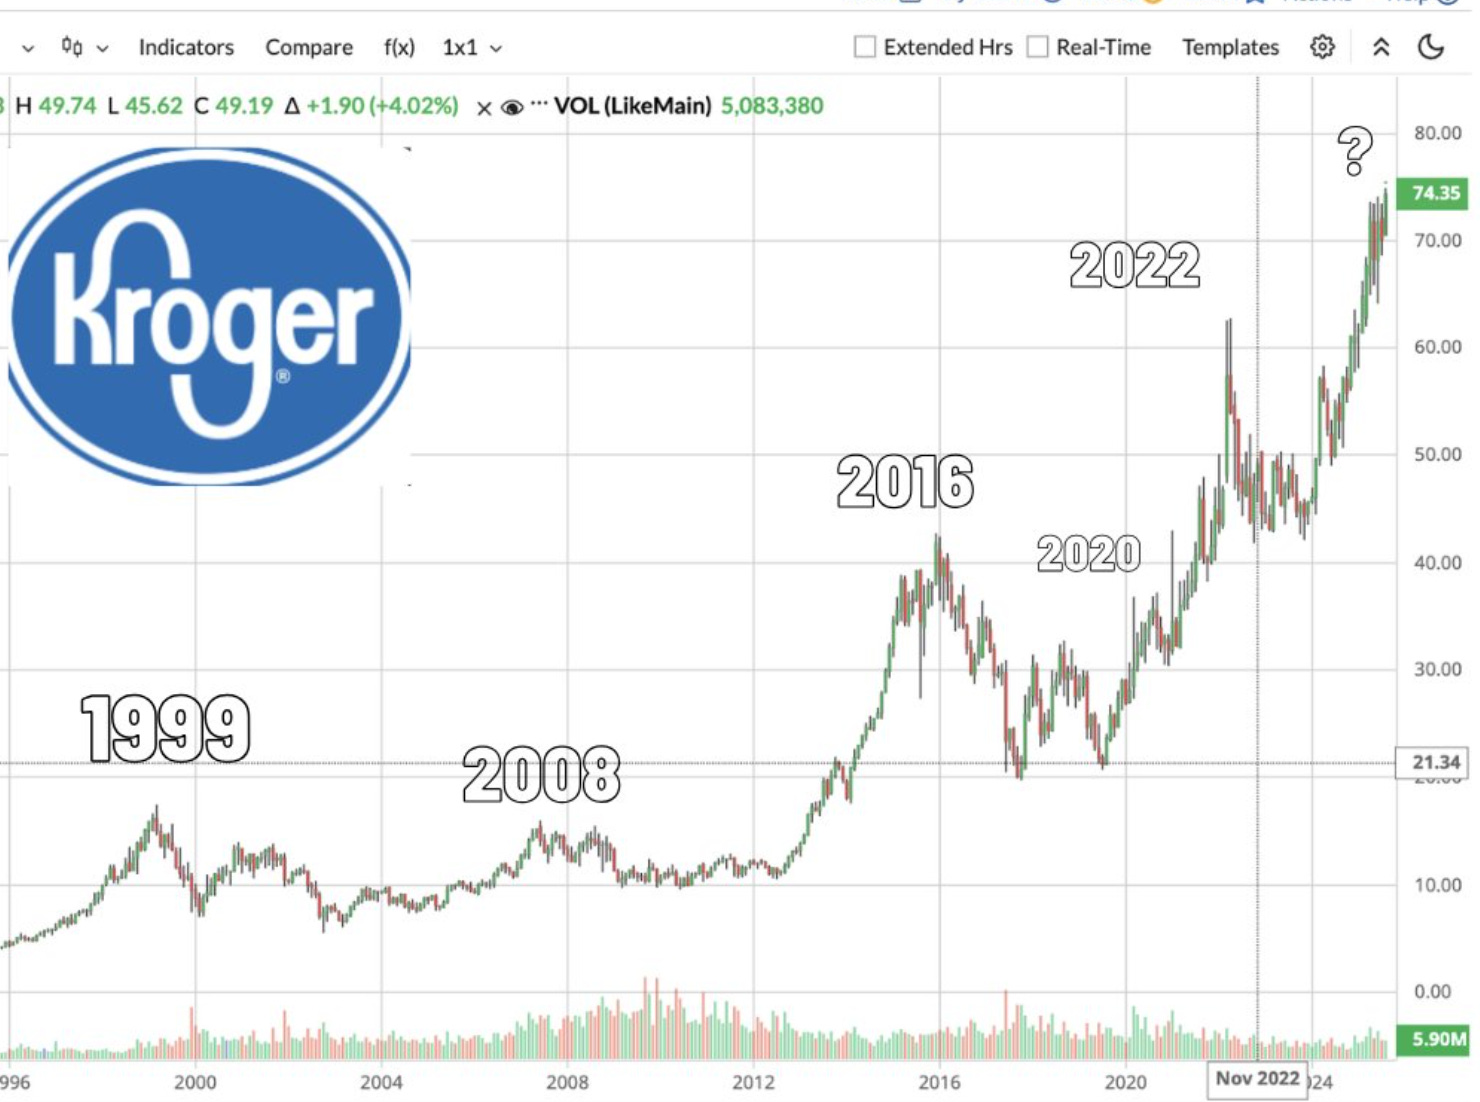
From the chart, I see 5 key events
1999 - Tech crash
2008 - Real Estate crash
2016 - China crash, Brexit, and Trump gets elected
2020 - Covid crash
2022 - Inflation, Interest Rates, Fear of Recession
2025 - Indication of extremes
So it can be argued from this that Krogers moves up WITH the market, not afterwards. So while tech and other companies can have beautiful trends for many years, Krogers does as well and tends to have a flourish at the point the market corrects. I am not going to say a crash because that’s what occurred in the past. I cannot predict the future and certainly not one stock. But a great barometer and 6 data points of important timing is nothing to sneeze at and quite possibly why the Oracle of Omaha bought a big stake to have a look at the underlying data of consumer behavior, since we are seeing that the US government data may not be accurate.
One more thing I would like to add, is the small blimps of 2008 and 2020. You would think that those two year would have massive moves but in fact while a top occurred there was no true sell off. Yet, those two times were probably the best two buying opportunities of a lifetime. 1999 was also but it took 2-3 years before it kicked into gear, not with 08 and 20 variety. So if Krogers indicator will work again take note on how deep its sell off as well.
Look forward in sharing with you more things that I find interesting.
Disclaimer: This is for entertainment and education purposes only. Anytime you invest you can lose all of your money.